Collecting browser logs for debugging
Sometimes, it can be helpful to send browser log messages to help us debug issues faster. Here's how:
Steps to collect browser logs from the SwiftRead window
If there's an issue/bug that occurs in the SwiftRead window itself, follow these steps to collect browser logs from the SwiftRead window:
- Activate SwiftRead on whatever webpage, document, etc. that produces the issue
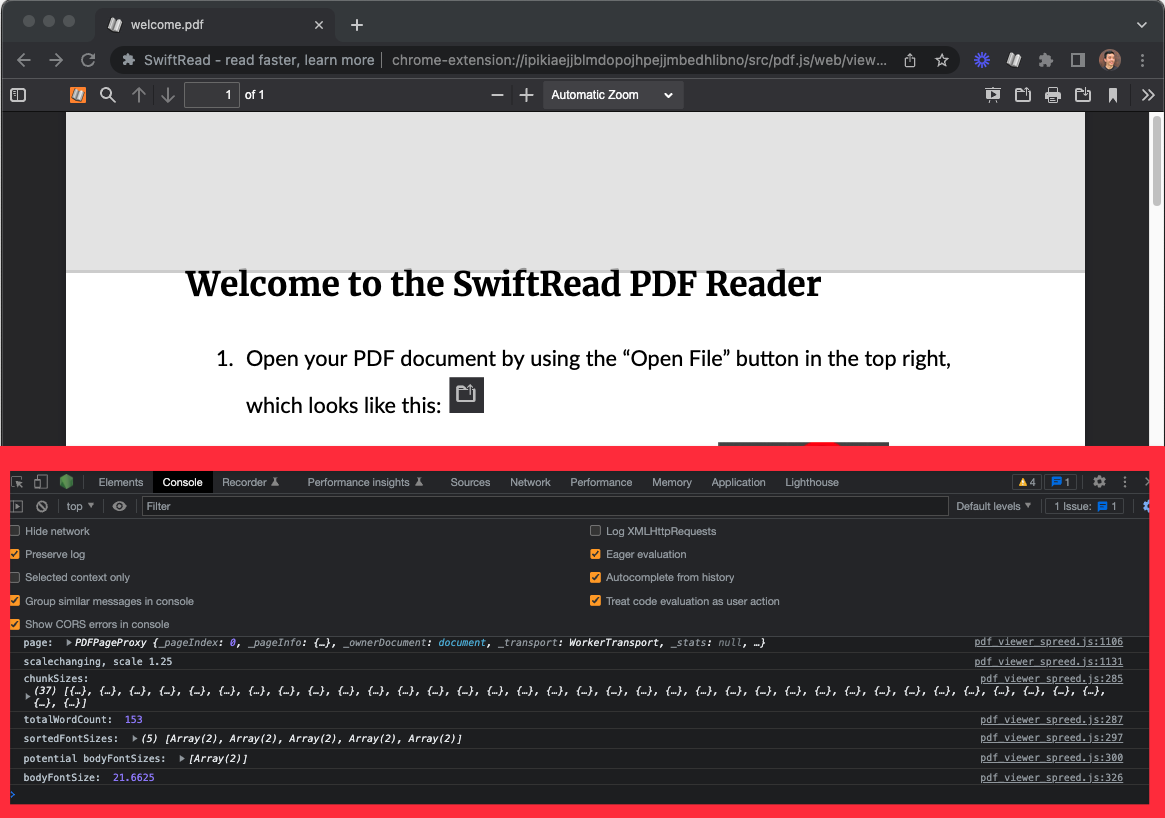
- After the issue occurs in the SwiftRead window, open the "Javascript Console" with the following hotkeys: Command+Option+J on Mac or Control+Shift+J on Windows
- A separate window should open in the SwiftRead window that has the title "DevTools", with the "Console" tab selected. This is highlighted by the red rectangle in the screenshot below
- Take a screenshot and/or copy-paste all the log messages in the "Console" tab.
Steps to collect browser logs from the source URL or document window
Sometimes, the issue/bug occurs before activating SwiftRead, so you'll need to collect the browser logs from the source URL or document that you're trying to use SwiftRead on. Here's how:
- Open the URL in your browser, or the document (e.g. PDF, ePub) in SwiftRead's PDF, ePub, etc. reader.
- Activate SwiftRead.
- After the issue occurs, go back to the window/tab with the source URL or document that you were trying to read with SwiftRead.
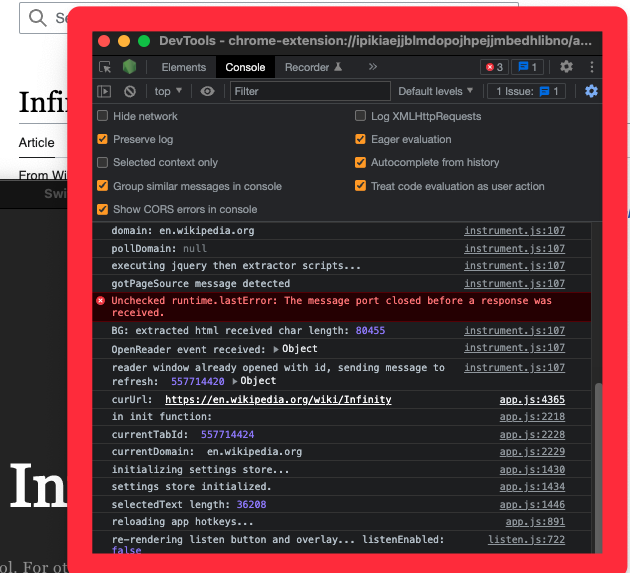
- Open the "Javascript Console" with the following hotkeys: Command+Option+J on Mac or Control+Shift+J on Windows.
- A separate window pane should open in the current window/tab, with the "Console" tab selected. This is highlighted by the red rectangle in the screenshot below.
- Take a screenshot and/or copy-paste all the log messages in the "Console" tab.